Graph analytics, or Graph algorithms, is designed to derive insights from interconnected data represented as a graph. While traditional analytics focuses more on individual data points, graph analytics places significant emphasis on the connections between data, uncovering insights that are not immediately apparent.
This page covers the basics of graph analytics. For the complete guide, refer to Ultipa Graph Analytics & Algorithms.
Graph Algorithm Library
Ultipa offers a rich collection of graph algorithms spanning the following categories:
Centrality
Ranks nodes within a graph based on various measures of importance.
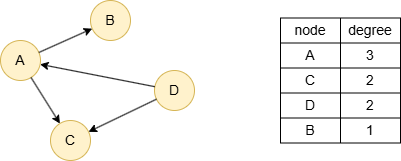
For example, the Degree Centrality algorithm evaluates a node's significance by the number of edges connected to it (i.e., degree), indicating its level of direct interaction with other nodes in the graph.
Similarity
Measures the degree of similarity between two nodes within a graph using various metrics.
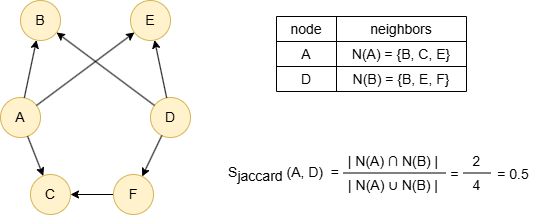
For example, the Jaccard Similarity algorithm computes the similarity between two nodes by comparing the intersection and union of their neighbors, reflecting how similar their neighborhoods are.
Connectivity & Compactness
Explores the overall or local connectivity or density of a graph.
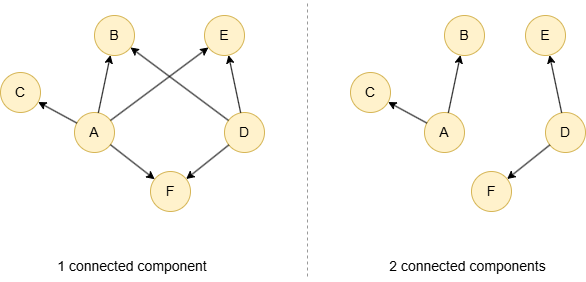
For example, the Connected Component algorithm identifies the connected components in a graph. A connected component is a maximal subset of nodes that are all connected to each other. If only one connected component is detected, it means that the graph is fully connected.
Pathfinding
Finds the shortest or cheapest paths between nodes in a graph, or visits all nodes systematically.
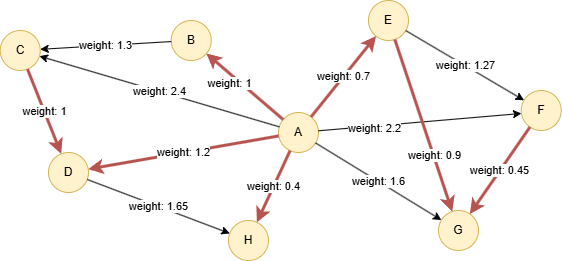
For example, the Minimum Spanning Tree algorithm searches for the spanning tree with the minimum sum of edge weights in a graph, resulting in the lowest possible cost.
Topological Link Predication
Predicts the likelihood of an edge (link) forming between two nodes that are not yet connected, based on the existing structure of the graph.
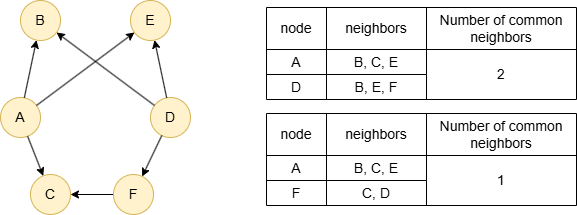
For example, the Common Neighbors algorithm counts the common neighbors between two nodes as the predication score. The intuition is that nodes with many shared neighbors are likely to form a connection in the future.
Community Detection & Classification
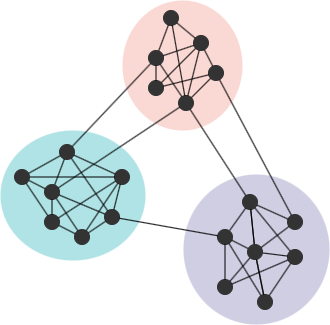
Identifies groups of nodes in a graph that are more densely connected to each other than to the rest of the graph.
For example, the Louvain algorithm detects communities in the graph while maximizing its modularity, where modularity is one of the widely used methods to evaluate the quality of a community partition.
Graph Embedding
Maps nodes into continuous vector spaces while preserving the structure and attributes (node and edge properties) within the graph. The purpose of graph embedding is to transform graph data into vectors that can be used for downstream machine learning tasks.
For example, below shows the results of running an embedding algorithm to a graph. In the graph, the colors of the nodes indicate their communities. Once all nodes are transformed into two-dimensional vectors, it's evident that nodes within the same community are positioned relatively closer to each other, meaning the graph structure is well retained.
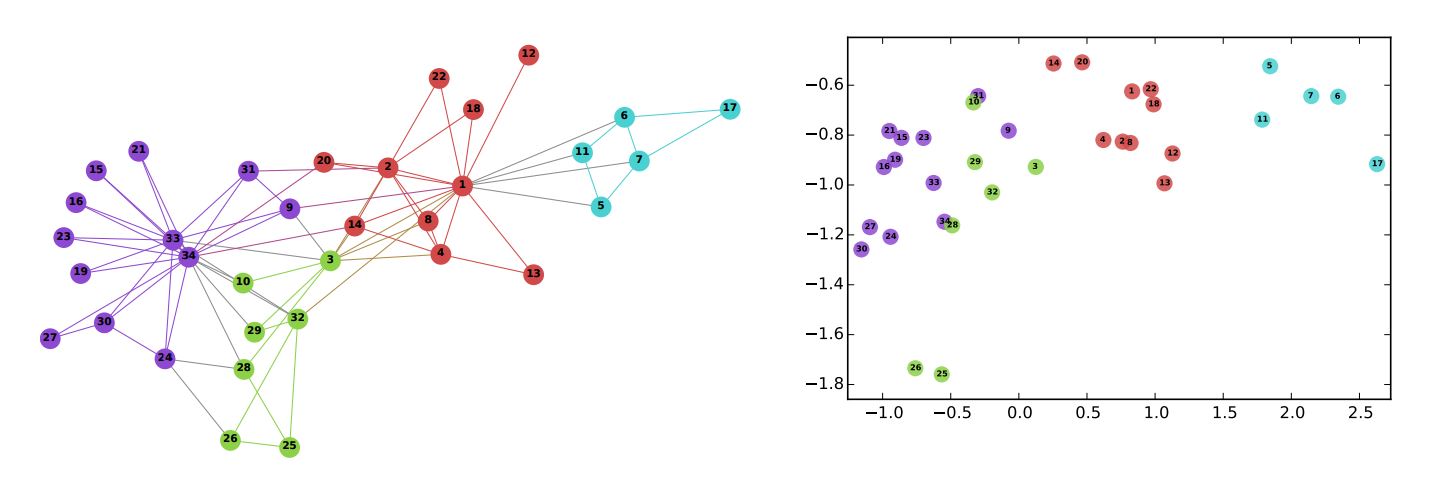 Source: B. Perozzi, et al., DeepWalk: Online Learning of Social Representations (2014)
How to Run Algorithms
Use GQL to run algorithms in Ultipa. To achieve optimal performance, you should create either an HDC graph or a distributed projection for your graph, on which the algorithms will run.
To create an HDC graph my_hdc_graph on the HDC server hdc-server-1 while loading your entire graph:
CREATE HDC GRAPH my_hdc_graph ON "hdc-server-1" OPTIONS {
  nodes: {"*": ["*"]},
  edges: {"*": ["*"]},
  direction: "undirected",
  load_id: true,
  update: "static"
}
To run the Degree Centrality algorithm on my_hdc_graph and return the top 10 nodes with the highest degrees:
CALL algo.degree.run("my_hdc_graph", {
  return_id_uuid: "id",
  limit: 10,
  order: 'desc'
}) YIELD r
RETURN r
Ultipa graph algorithms support six execution modes: File Writeback, DB Writeback, Stats Writeback, Full Return, Stream Return, and Stats Return. These modes allow you to choose whether to return the results directly to the client or save them to a file or database, depending on your specific needs and use case.

