
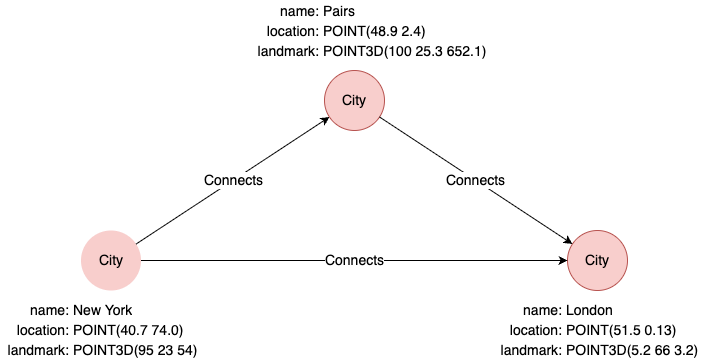
Example Graph
The following examples run against this graph:
distance()
Computes the straight-line distance between two points.
| Syntax | distance(<point1>, <point2>) |
||
| Arguments | Name | Type | Description |
<point1> |
POINT or POINT3D |
The first point | |
<point2> |
POINT or POINT3D |
The second point | |
| Return Type | DOUBLE |
||
find().nodes({name == "New York"}) as p1
find().nodes({name == "London"}) as p2
return distance(p1.location, p2.location)
Result:
| distance(p1.location, p2.location) |
|---|
| 5571177.78487926 |
point()
Constructs a two-dimensional geographical coordinate. The point() function can be used to specify the value of a point-type property.
| Syntax | point({latitude: <lati>, longitude: <longti>}) |
||
| Arguments | Name | Type | Description |
<lati> |
Numeric | The latitude value | |
<longti> |
Numeric | The longitude value | |
| Return Type | POINT |
||
return point({latitude:39.9, longitude:116.3}) as point
Result:
| point |
|---|
| POINT(39.9 116.3) |
insert().into(@City).nodes([{name: "Tokyo", location:point({latitude: 35.7, longitude: 139.7})}]) as n
return n.location
Result:
| n.location |
|---|
| POINT(35.7 139.7) |
point3d()
Constructs a three-dimensional Cartesian coordinate. The point3d() function can be used to specify the value of a point3d-type property.
| Syntax | point3d({x: <value_x>, y: <value_y>, z: <value_z>}) |
||
| Arguments | Name | Type | Description |
<value_x> |
Numeric | The x value | |
<value_y> |
Numeric | The y value | |
<value_z> |
Numeric | The z value | |
| Return Type | POINT3D |
||
return point3d({x:10, y:15, z:5}) as point3d
Result:
| point3d |
|---|
| POINT3D(10 15 5) |
insert().into(@City).nodes([{name: "Tokyo", landmark: point3d({x:10, y:15, z:5})}]) as n
return n.landmark
Result:
| n.landmark |
|---|
| POINT3D(10 15 5) |